Infographics projects
NerdWallet Odds of a Fatal Accident Infographic
This infographic breaks down the chances of various types of fatal accidents in a way that’s easy to understand. Because the topic deals with serious and sometimes unsettling data, the visuals were created with a light, less literal style—making the information approachable without downplaying its importance. Client: NerdWallet.
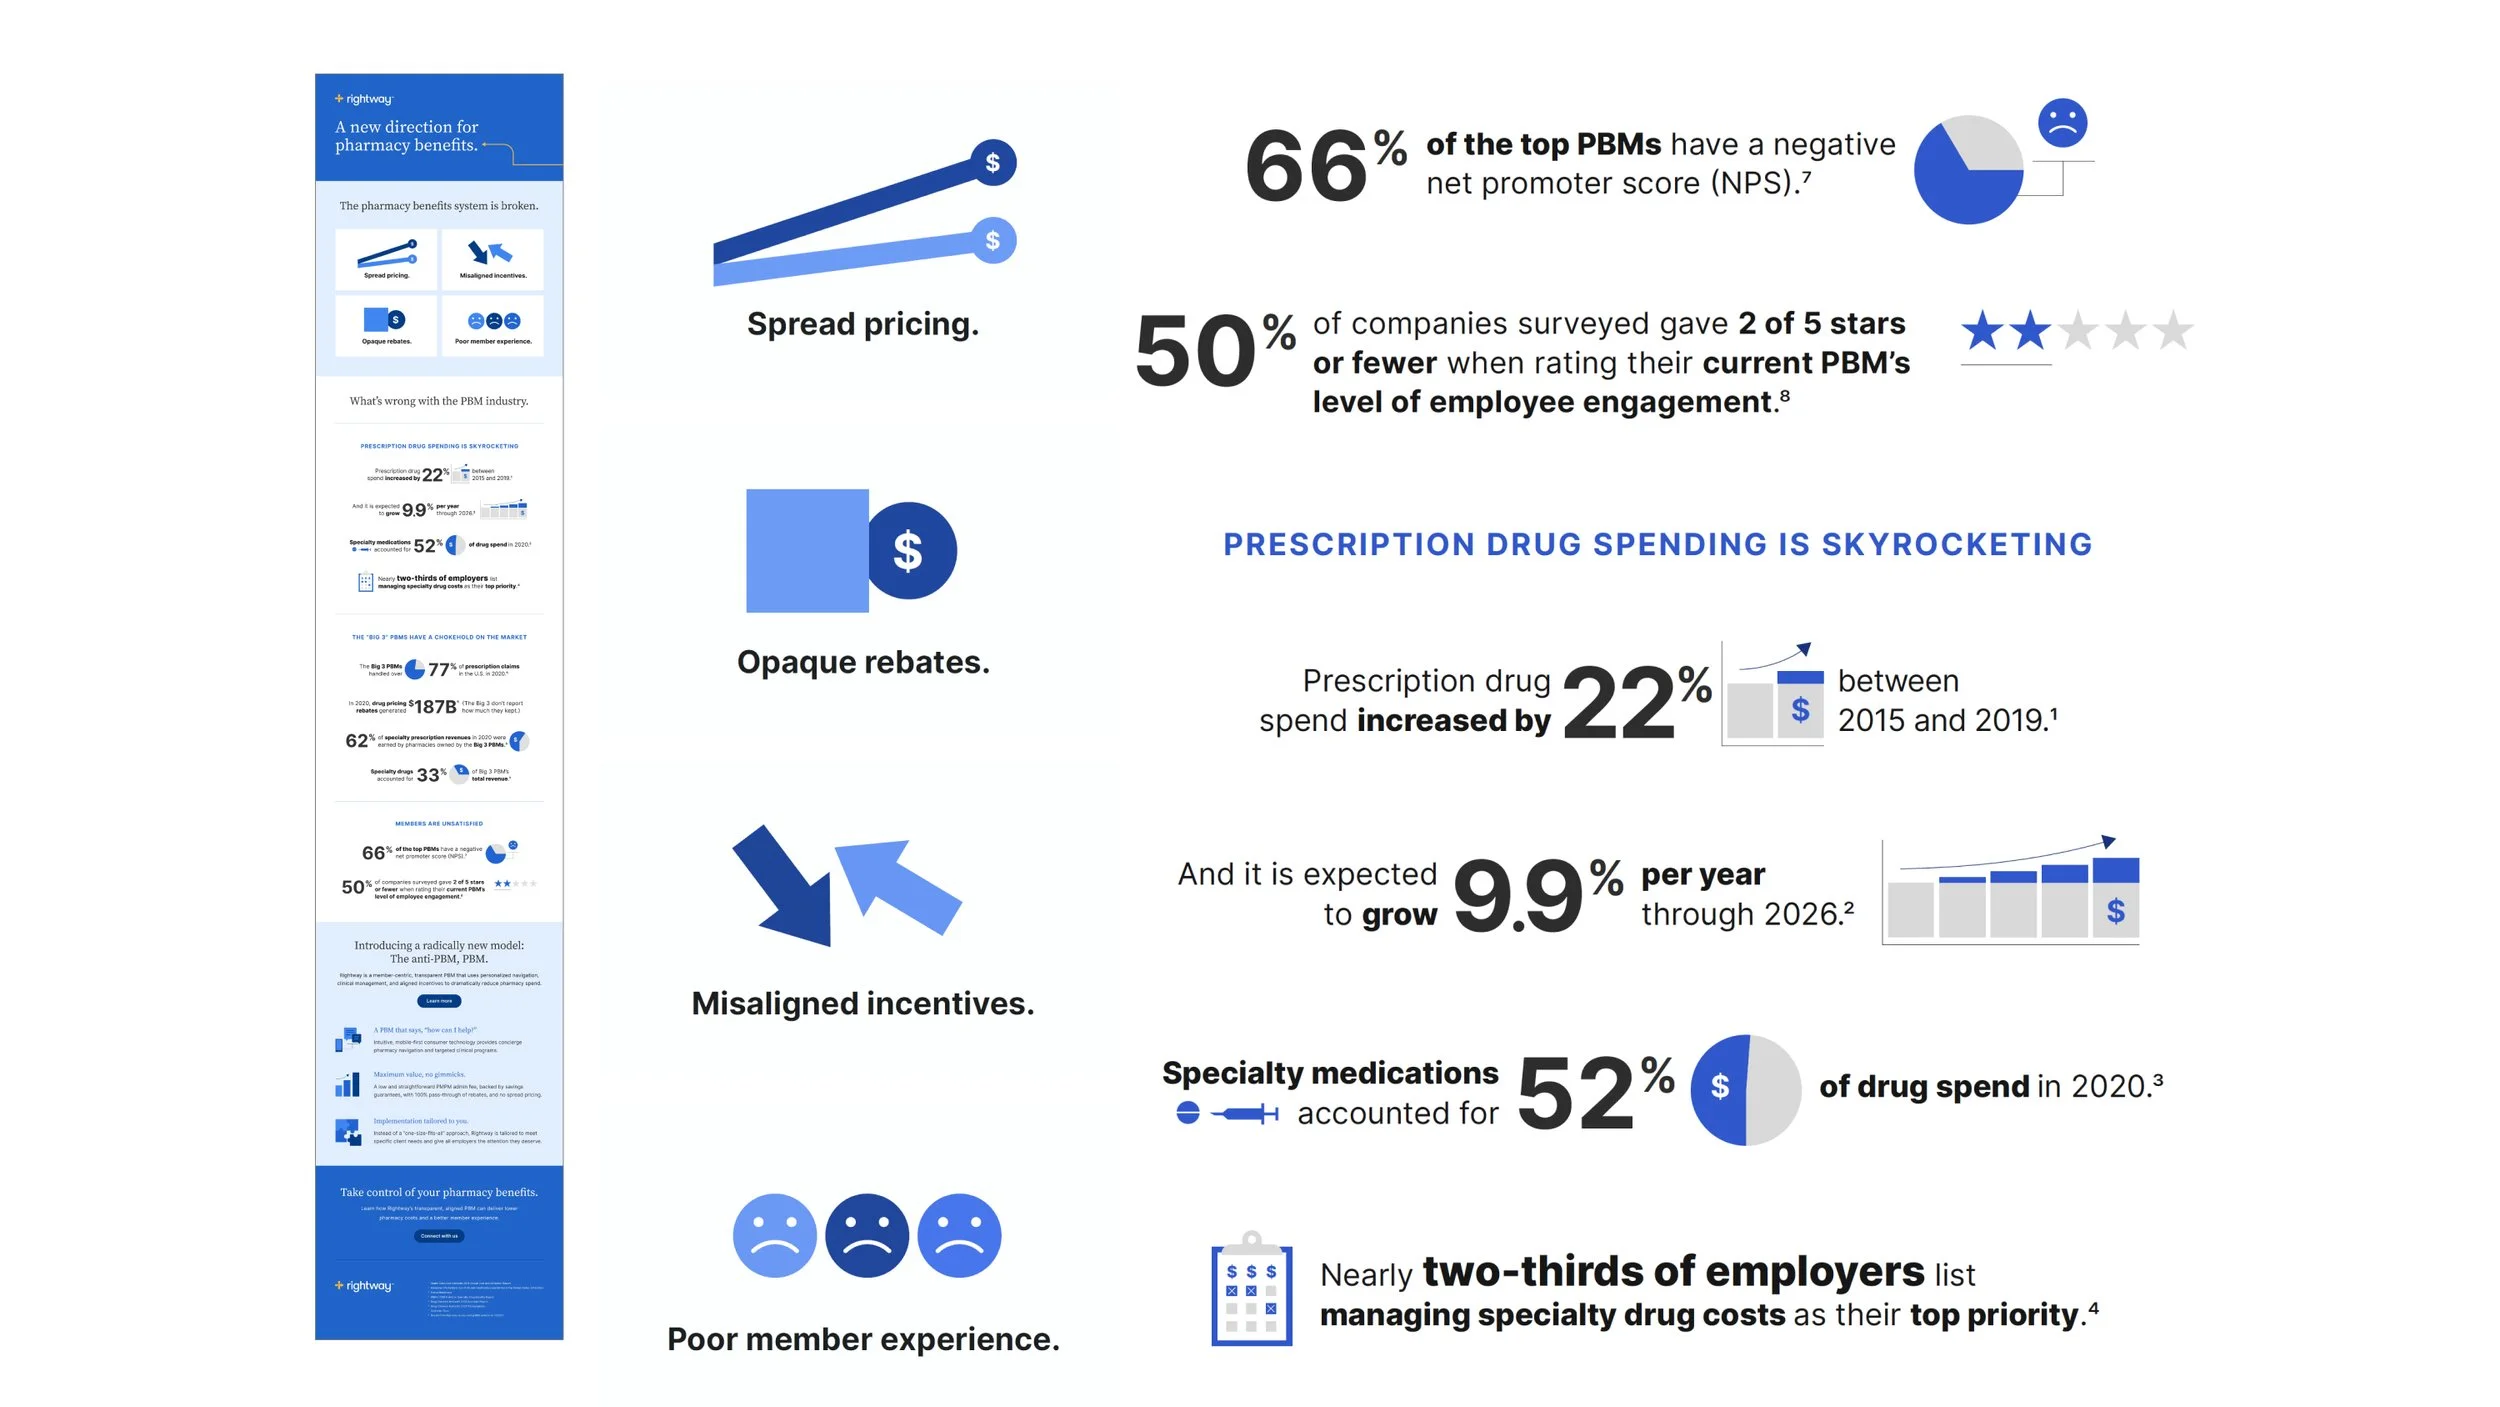
Rightway Big 3 PBMs Infographic
This infographic was developed to visualize the outsized influence of the three dominant pharmacy benefit managers in the U.S. Using a data-centric design approach, each piece highlights the systemic impacts of market consolidation—elevated drug prices, opaque business practices, and diminished outcomes for patients. Client: Rightway.
Health Mart Preferred Networks Infographics
These infographics were created to support a guide for independent pharmacies joining the Health Mart network. Designed to simplify the complexities of Medicare Part D, the visuals distill key information into approachable, easy-to-scan formats that clarify challenges and benefits at a glance. Client: McKesson.
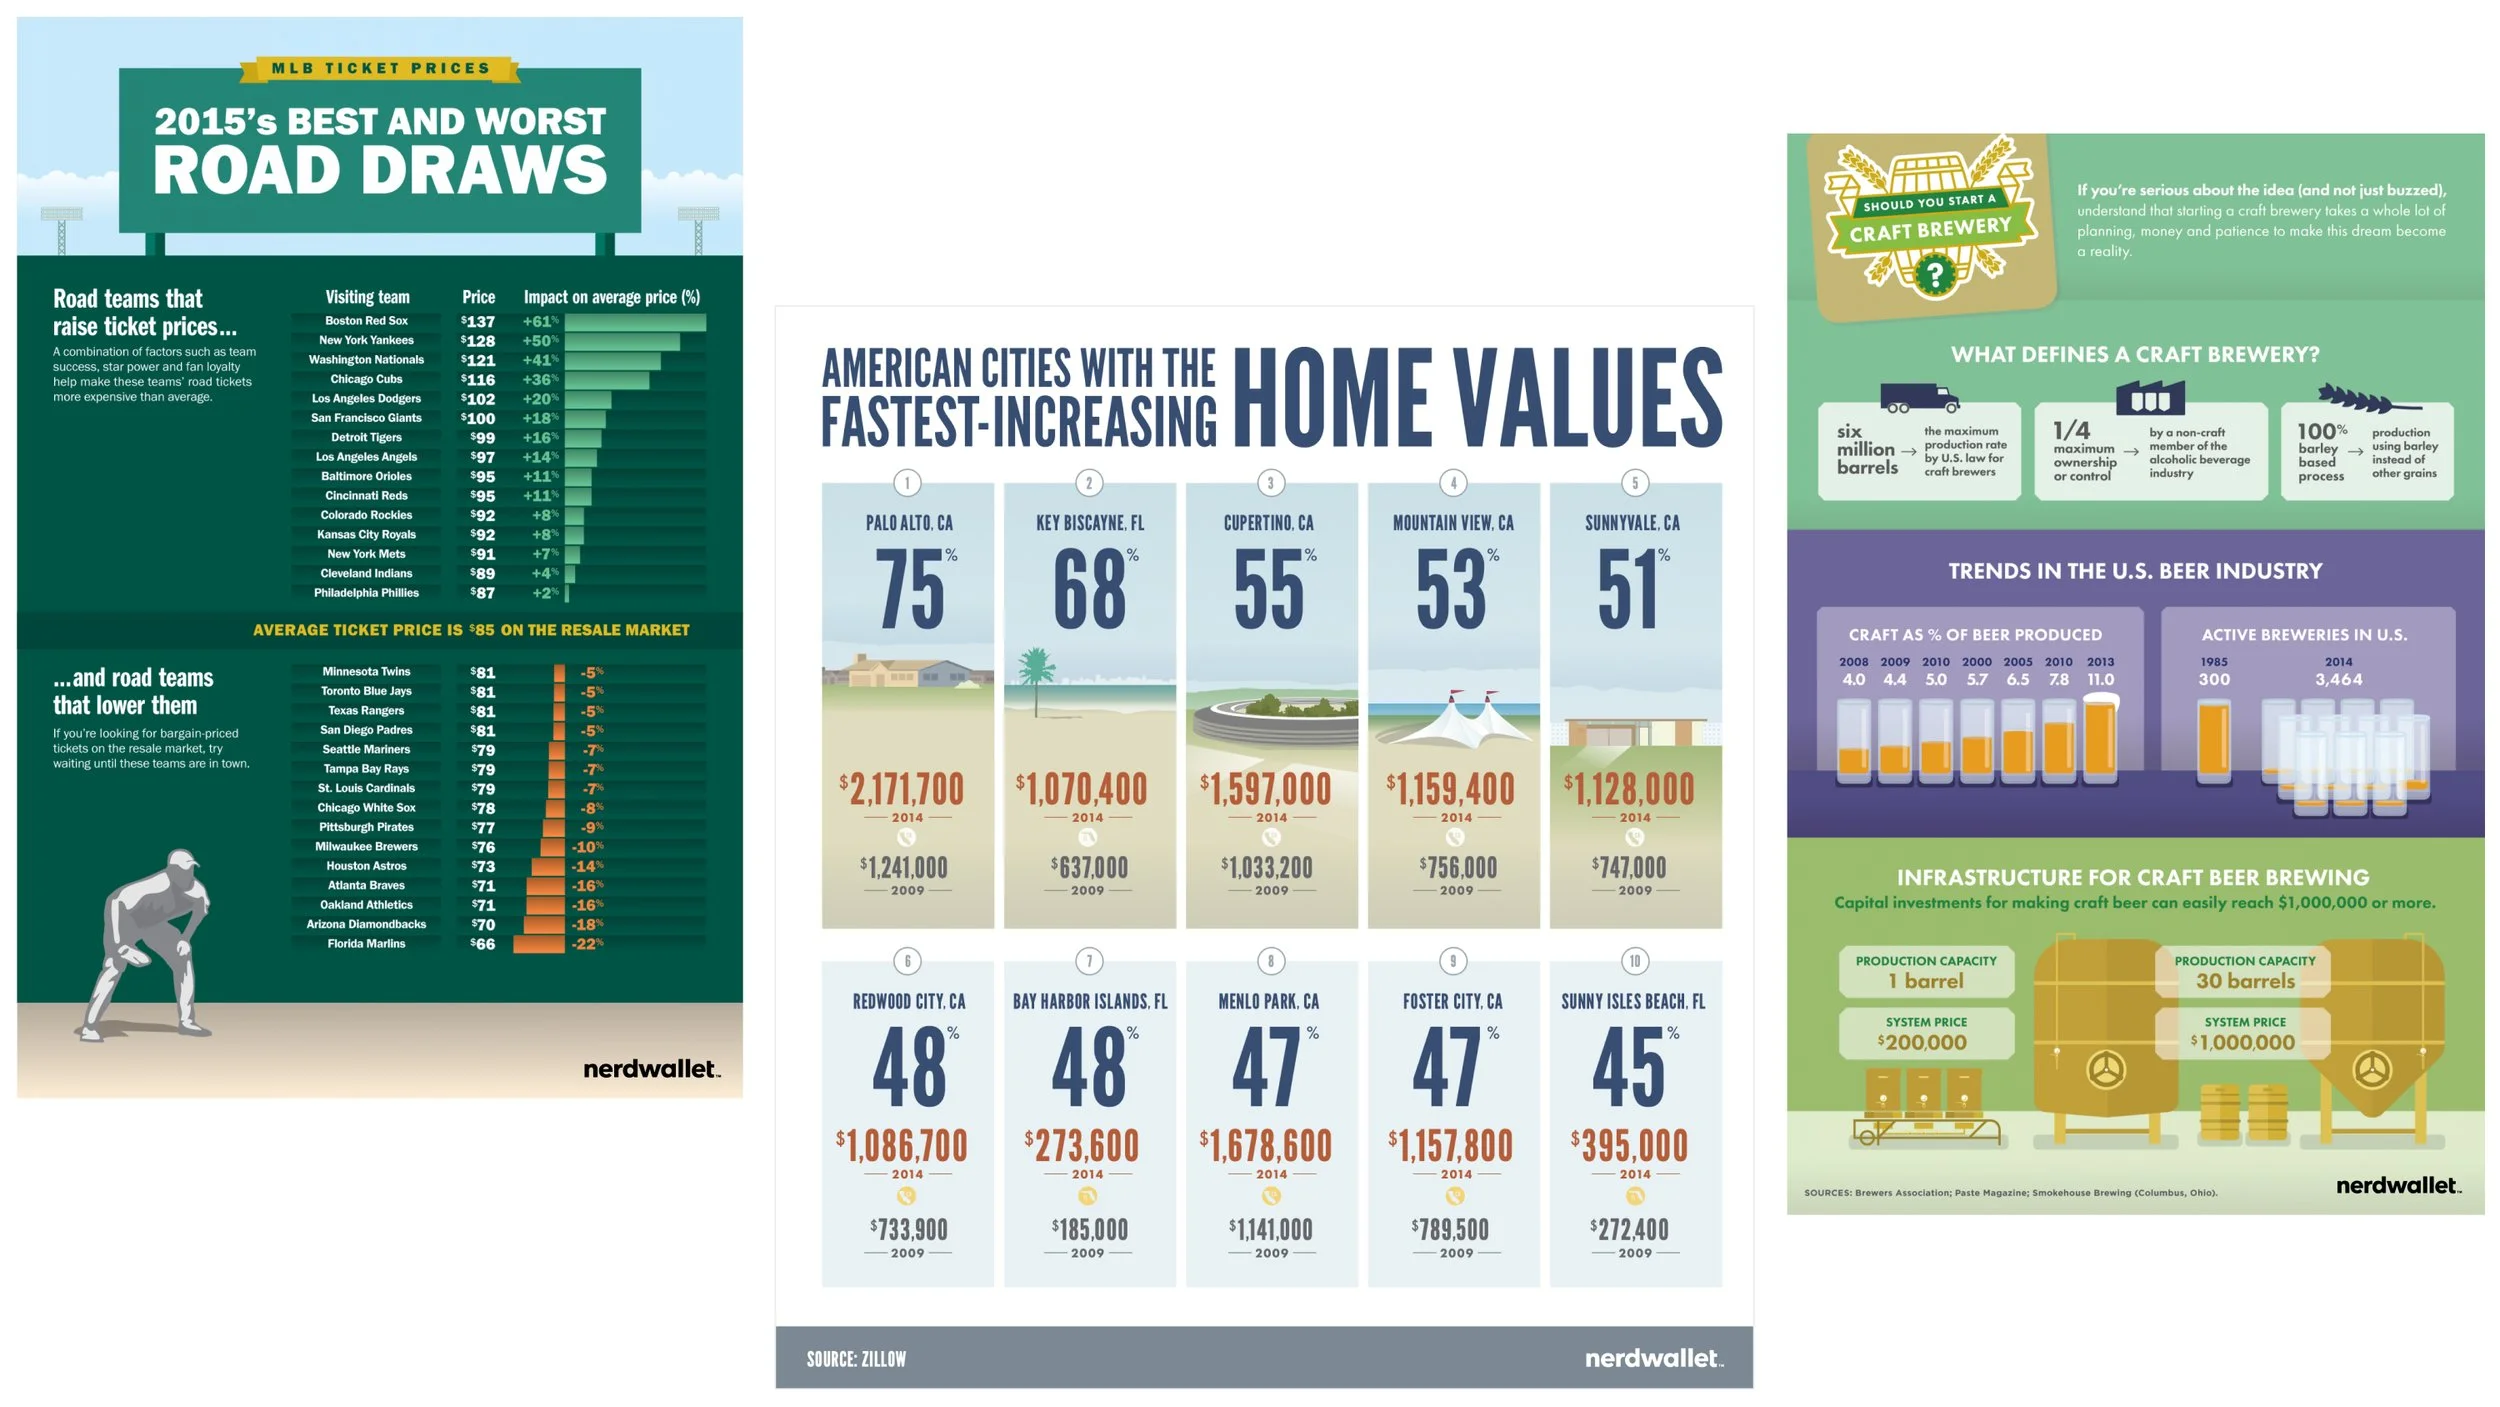
NerdWallet Relatable Economics Infographic Series
This infographic series brought economic data to life through engaging, accessible visuals. Topics ranged from the draw power of visiting MLB teams, to America’s fastest-growing home values, to the viability of launching a craft brewery. Each piece translated complex stats into stories designed to inform and spark curiosity. Client: NerdWallet.
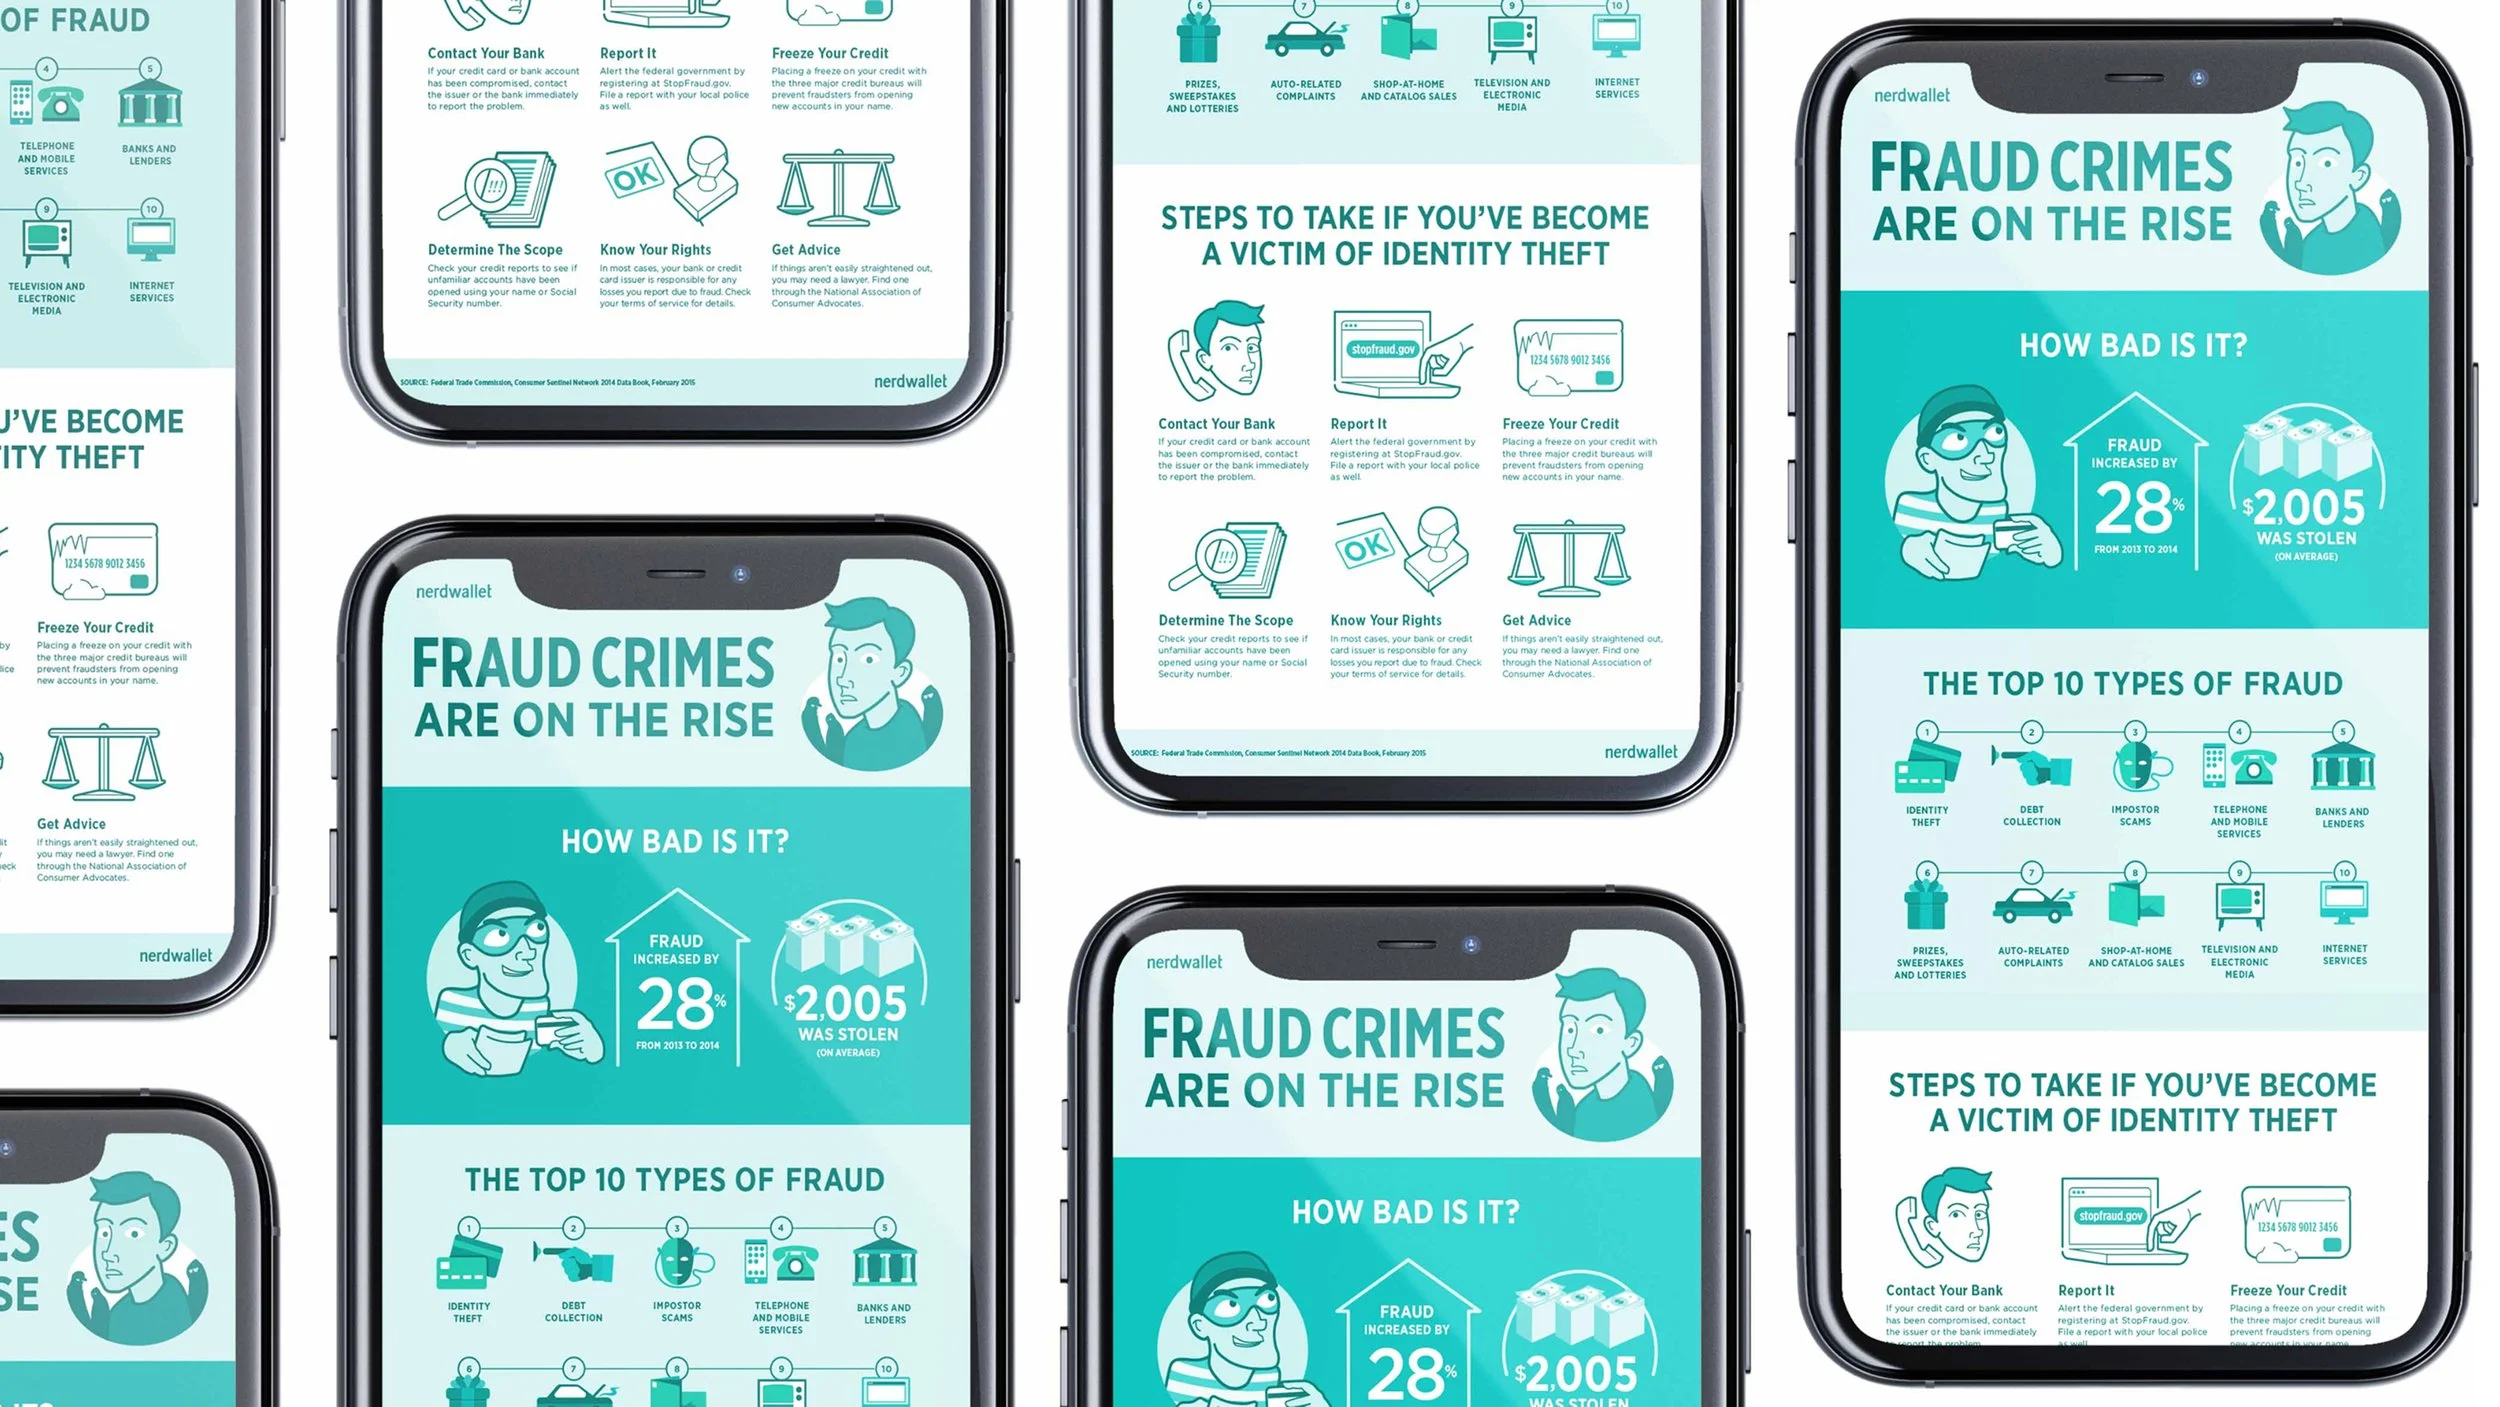
NerdWallet Fraud Crimes Infographic
This infographic distills key data on the top 10 most common types of fraud reported by law enforcement, alongside rising fraud trends and average financial losses. A supporting callout section offers actionable steps for identity theft victims. Designed for clarity and impact, the piece complements NerdWallet’s data-driven editorial approach. Client: NerdWallet.


